Technologies of CLST
CAGE : A method for genome-wide identification of transcription start sites
CAGE (Cap Analysis of Gene Expression) is based on a series of full-length cDNA technologies developed in RIKEN. Research by Piero Carninci and Yoshihide Hayashizaki in the late 1990s, which started with the cap trapper method, use of trehalose, the normalization/subtraction method, and a new cloning vector, set the stage for development of Cap Analysis of Gene Expression. With cap trapper, full-length cDNA/mRNA hybrids are isolated, and the mRNA is chemically biotinylated on the cap structure and streptavidin-coated magnetic beads capture the hybrids. Previously fragments were cleaved and concatenated in CAGE tags, but current “next generation” sequencers (Illumina, SOLiD, Helicos) do not need cleavage and the tags can be directly sequenced to produce millions of tags per sample.
Advantages:
- Specific to transcription start sites
- Selective to capped RNAs
- Detects both known / unknown transcripts
- Detects also non-polyadenylated RNAs
- Highly quantitative
- Little-biased (nAnT-iCAGE; no PCR amplification, no restriction enzyme digestion nor hybridization)
Wide variety of applications:
- TSS identification (mRNA, ncRNA)
- Gene structure analysis (mRNA 5' end)
- Sense / antisense expression analysis
- Prediction of promoters / enhancers
- TF binding motif analysis
- Genome annotation
- Tissue / cell / subcellular compartment specific analyses
- Association study of transcription regulatory elements and factors
- Time course profiling of transcription regulatory elements and factors
- Profiling of disease related transcripts
Cap Analysis Gene Expression is a technology focused on the 5' sequence analysis, capturing capped 5' end of RNAs,
originally developed by RIKEN in 2003 (Shiraki et al, 2003). TTSS sequence is quite informative, since you can find
corresponding promoter sequence (located in adjacent upstream of it) and, thereby, you can also predict transcription factor (TF) regulation for each transcript.
We further combined this method with next generation sequencer techniques and succeeded to construct an accurate high throughput technology for transcription start site (TSS) profiling and quantification (Maeda et al, 2008; Suzuki et al, 2009; Takahashi et al, 2012; Kanamori-Katayama et al, 2011). For samples yielding nanograms of total RNA (in the range of 1–10,000 cells), we have developed nanoCAGE (Plessy et al., 2010). This method was the basis for our “C1 CAGE” method for single-cell analysis.
For the details of nanoCAGE, please see HERE
The CAGE technologies enable us to determine the TSS in high-resolution, as well as transcript quantification, promoter prediction, TF usage prediction and enhancer identification. For example, by using the CAGE method, Haberle et al (2014) revealed that a single promoter sequence induces transcription initiation from two distinct TSSs. Utilizing this CAGE technology, RIKEN-based international consortium FANTOM5 identified promoters (The FANTOM Consortium, et al, 2014) across 975 human and 399 mouse samples, including primary cells, tissues and cancer cell lines, using single-molecule sequencing.
From these datasets, transcribed enhancers were also identified in human cells (Andersson et al, 2014).
Further analyses of these CAGE datasets led to the finding that transcription at enhancers occur first, followed
by transcription of transcription factors, and finally of genes that are not transcription factors (Arner, et al, 2015).
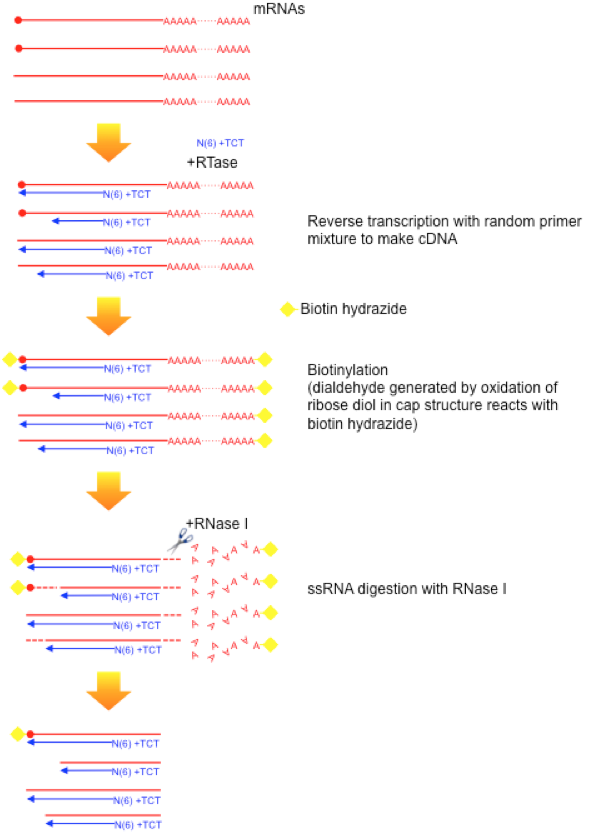
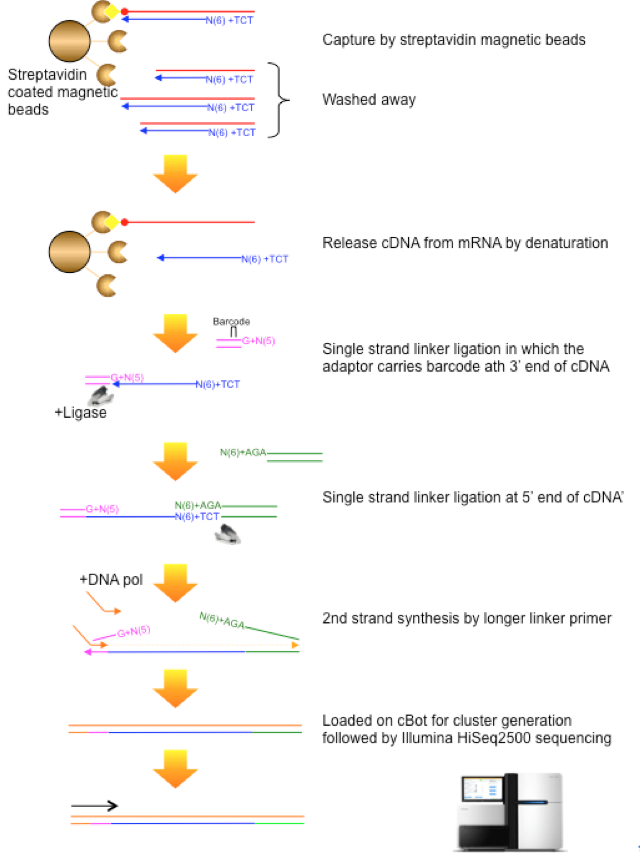
Figure1: Cap Analysis Gene Expression technology, originally developed by RIKEN in 2003 (Shiraki et al, 2003).
Figure 2 illustrates the latest protocol of nAnT-iCAGE (Murata et al., 2014) that does not involve PCR amplification or enzyme restriction, followed by sequencing on HiSeq 2500 (Illumina). This method is applicable to capped RNAs with lengths of 100 nt or more, thus there is no contamination of tRNA fraction. To reduce rRNA contamination, we apply non-porous magnetic beads for capture.
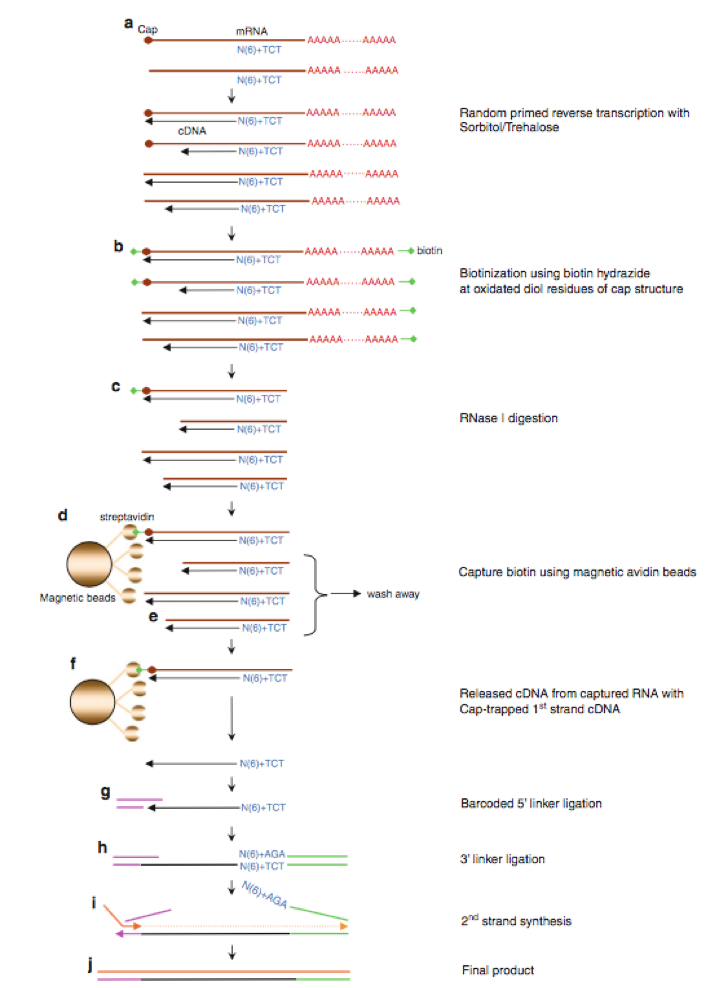
Fig.2 nAnt-iCAGE protocol workflow(Murata et al., 2014)
a) Reverse transcription
cDNA is synthesized using SuperScipt III and random N6 plus 3 base anchor primer.
b) Oxidation/biotinylation
The cap structure is oxidized with sodium peroxide and bbiotinylated with biotin (long arm) hydrazine.
c) RNaseI digestion
Sigle-strand RNA is digested with RNase I.
REFERENCES
- Cap analysis gene expression for high-throughput analysis of transcriptional starting point and identification of promoter usage.", Shiraki, et al., PNAS, 100, 15776-81 (2003)
- Development of a DNA barcode tagging method for monitoring dynamic changes in gene expression by using an ultra high-throughput sequencer. Maeda, et al. Biotechniques, 45, 95-7 (2008)
- The transcriptional network that controls growth arrest and differentiation in a human myeloid leukemia cell line. Suzuki, et al. Nat Genet, 41, 553-62 (2009)
- Linking promoters to functional transcripts in small samples with nanoCAGE and CAGEscan. Plessy et al., “Nature Methods, 7, 528-34 (2010)
- 5' end-centered expression profiling using cap-analysis gene expression and next-generation sequencing. Takahashi, et al. Nature Protocols, 7, 542-61 (2012)
- Unamplified cap analysis of gene expression on a single-molecule sequencer. Kanamori-Katayama., et al,Genome Research, 21, 1150-9 (2011)
- Two independent transcription initiation codes overlap on vertebrate core promoters. Haberle, et al., Nature, 507, 381-5 (2014)
- A promoter level mammalian expression atlas. The FANTOM Consortium, et al., Nature, 507, 462-70 (2014)
- Detecting expressed genes using CAGE. Murata et al., Methods in Molecular Biology, 1164, 67-85 (2014)
- An atlas of active enhancers across human cell types and tissues., Andersson et al., Nature, 507, 455-61 (2014)
- Transcribed enhancers lead waves of coordinated transcription in transitioning mammalian cells. Arner et al., Science, 347, 1010-4 (2015)

